Offline Conversions
Part of Search ad experiments
Measuring whether a brand campaign adds incremental demand
Use a credible holdout and total business outcomes to assess whether brand Search ads add value beyond visits that may arrive anyway.
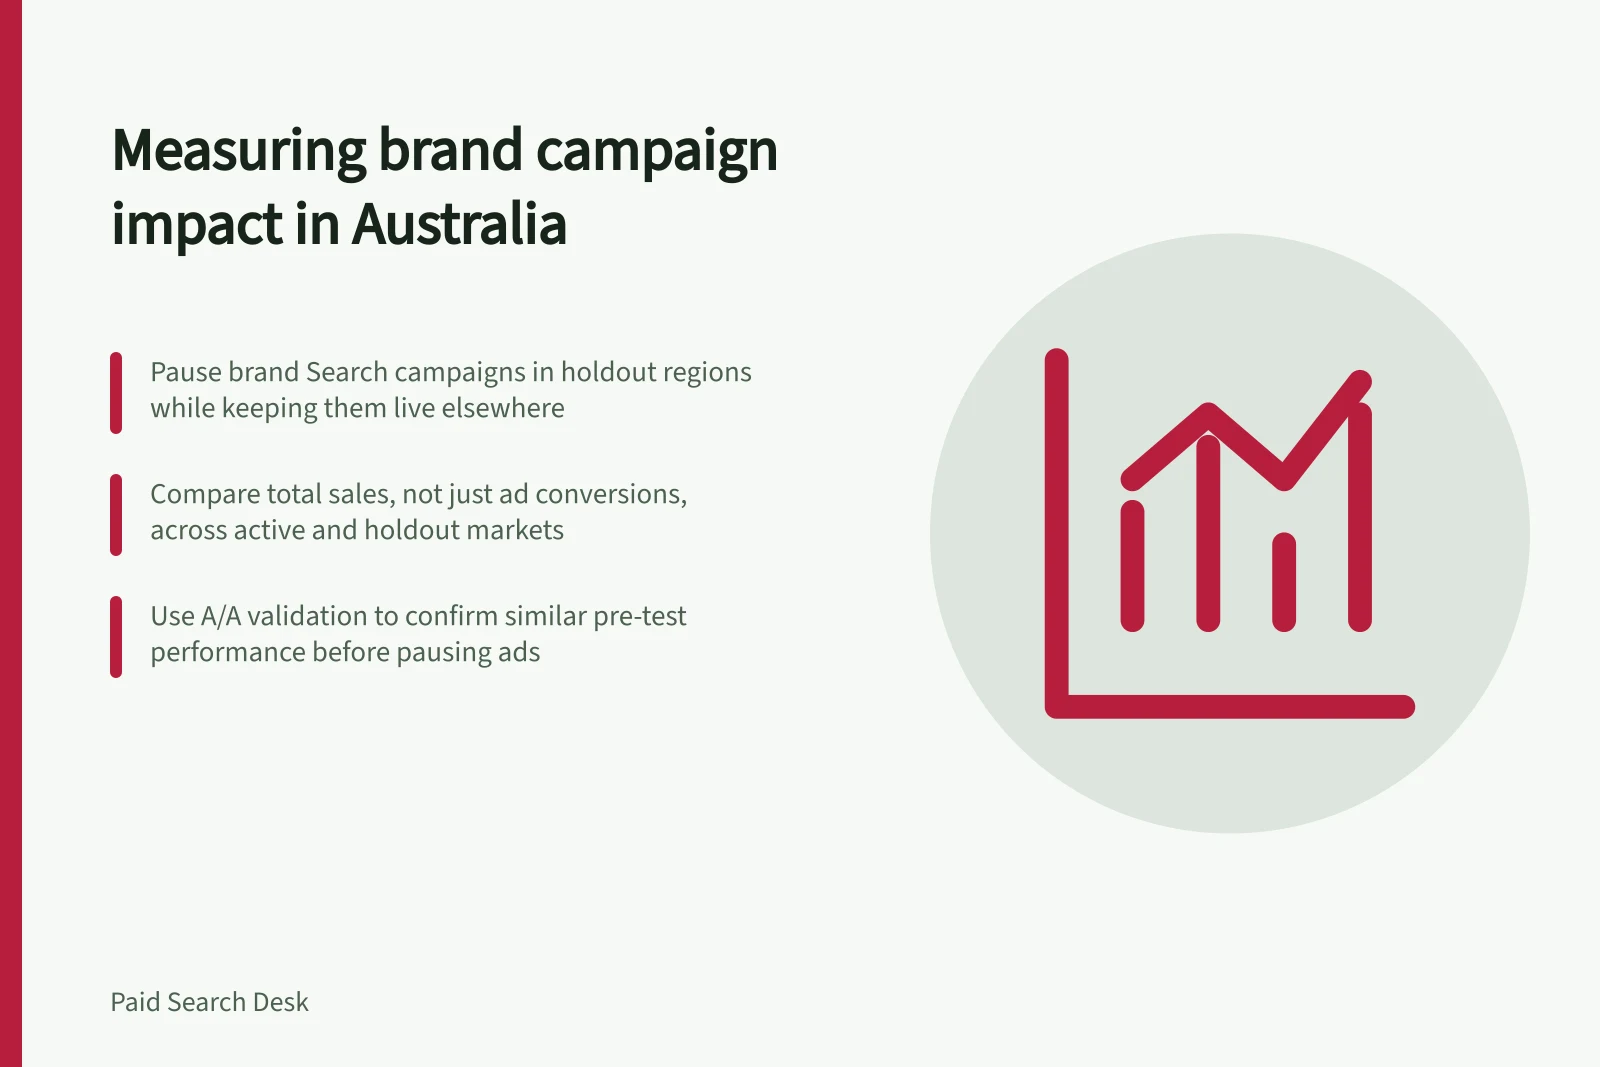
Assess an existing brand Search campaign with a geographic holdout: leave it active in selected markets and pause it in comparable holdout markets. Compare total business outcomes across paid, organic and direct routes, rather than ad-attributed conversions alone, because a customer credited to an ad may have arrived through another route anyway.
Here, “incremental demand” means additional useful enquiries or sales attributable to keeping the brand campaign active. It does not mean the ads caused the original searches for the brand.
Choose a feasible holdout
Use a market-level geo experiment or pause the campaign in selected areas while keeping it live in control areas. Google Ads names a geo-experiment campaign implementation path; define the groups and dates before launch.
Choose areas using pre-test outcomes, brand-search activity, service capacity and other marketing exposure. Prefer regions with similar historical sales patterns, seasonality and trends; a region that the business serves differently may be a poor comparison.
Randomly assign suitable areas to active and holdout groups where practicable. If you select regions rather than randomising them, check that their aggregate outcomes track in parallel before the campaign is paused.
SegmentStream’s described sequence allows about 1 week for market selection, 2–3 weeks for A/A validation and 4–8 weeks of holdout execution. Use the A/A period to check that the groups track together before ads are paused.
Keep promotions and sales operations as steady as practicable, and record changes. Plan the budget treatment and location targeting in advance, then monitor spend by area so the holdout remains a genuine no-ad group.
Implementing a Geo Experiment for Brand Campaign Evaluation
- Week 1Select suitable regions based on pre-test outcomes, brand-search activity, and service capacity
- Weeks 2–3Conduct A/A validation to confirm groups track together before pausing ads
- Weeks 4–8Run holdout execution: pause campaign in holdout areas, maintain in active areas
- OngoingMonitor budget, location targeting, and external factors like promotions and stock levels
Measure outcomes across routes
Select one primary outcome before the holdout, such as confirmed orders or accepted enquiries assigned to a relevant customer region. Geo experiments compare the outcome in exposed and unexposed markets against a primary measure such as sales, sign-ups or subscriptions.
Use a business record that includes outcomes regardless of the route taken to the site. Treat paid, organic and direct route counts as supporting evidence, not as a substitute for the total outcome.
Compare changes from the pre-test period in active and holdout areas after allowing for sales delay. Estimate the effect by comparing the groups’ changes, account for baseline size and demand, and do not treat raw totals from differently sized regions as directly comparable.
Use route-substitution evidence to help interpret the total: paid clicks falling while organic visits rise may indicate that customers changed routes rather than disappeared. Keep total outcomes as the primary measure of whether the campaign added demand.
Measure / Role
- Total accepted enquiries or sales by region
- Main evidence about additional business outcomes.
- Brand ad spend and attributed conversions
- Cost and platform credit, not the incremental effect.
- Organic and combined brand-search activity
- Context for possible route switching.
- Promotions, stock and capacity
- Other changes that may affect the result.
Observational comparisons do not replace a holdout or establish additional customers.
Measuring Incremental Demand: Active vs Holdout Markets
- Total accepted enquiries or sales by region
- Main evidence about additional business outcomes
- Brand ad spend and attributed conversions
- Cost and platform credit, not the incremental effect
- Organic and combined brand-search activity
- Context for possible route switching
- Promotions, stock and capacity
- Other changes that may affect the result
Key Metrics for Assessing Incremental Demand
- Primary Outcome
- Confirmed orders or accepted enquiries by customer region
- Recommended Comparison
- Total business outcomes across paid, organic and direct routes
Interpret the result within its limits
If paid clicks disappear in holdout areas while organic visits rise and total outcomes hold steady relative to active areas, substitution is plausible. If total outcomes fall relative to a credible comparison, that supports incremental value.
Neither pattern is established by a few days of data or one attribution figure. Regional differences, other campaigns, conversion delay and low volume can leave the answer uncertain; groups that did not track together before the test also weaken the comparison.
Report the estimated change, uncertainty, campaign cost, regions, dates and exact customer outcome. Keep the conclusion bounded by the quality of the comparison and the uncertainty in the result.